Monitor all your Dataflow refreshes with a Power BI dashboard
We are pleased to announce an enhanced way to monitor your dataflow refresh history. You can now use the managed Dataverse tables to report over your dataflow refresh history. To access these tables, we suggest you use Dataverse connector in Power BI to set up your dashboard.

What is new?
As of today, we provide you two new managed Dataverse table with details about refreshes of your dataflows in your environment. We populate the tables with new data automatically after each refresh.
DataflowRefreshHistory – Contains the overall dataflow refresh history data
EntityRefreshHistory – Contains data of all entities involved in the refreshes
Using the new tables you are able to extract information about errors , duration of the refreshes and, how many new records got inserted into your Dataverse table.
To get you started we have set up a step-by-step guide to deploy a template which will give you insights right away. Go to the docs page and get started today with a more data driven monitoring experience.
How does it work?
The new tables are available in your environment right away. To find the tables in your environment; do the following:
- Navigate to https://make.preview.powerapps.com/
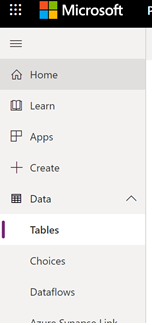
- Open the Dataverse tables overview:

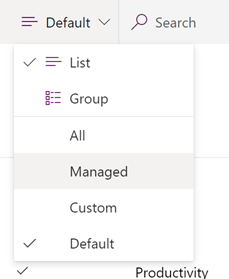
- Navigate to the managed tables section:

- Scroll down to the dataflow refresh history tables:

To use these tables, we suggest you to use Power BI to get data via the Dataverse connector. To help you bit, we suggest to leverage the guide and template from docs page.
Resources
Docs: Monitor your dataflow refreshes with Power BI – Power Query | Microsoft Docs


