I’m thrilled to announce a new instrumentation feature to allow makers collect detailed telemetry for their Canvas apps. Would you like to know how many people are using your App, where they are accessing it from, what screens are most visited, the devices or browsers that are most popular? Or maybe you want to monitor all errors presented to your users, and using this data, get automatically alerted if errors suddenly increase? With your app connected to Azure Applications Insights, you can now begin to gather this information to help you drive better business decisions and improve the quality of your apps.
Getting started
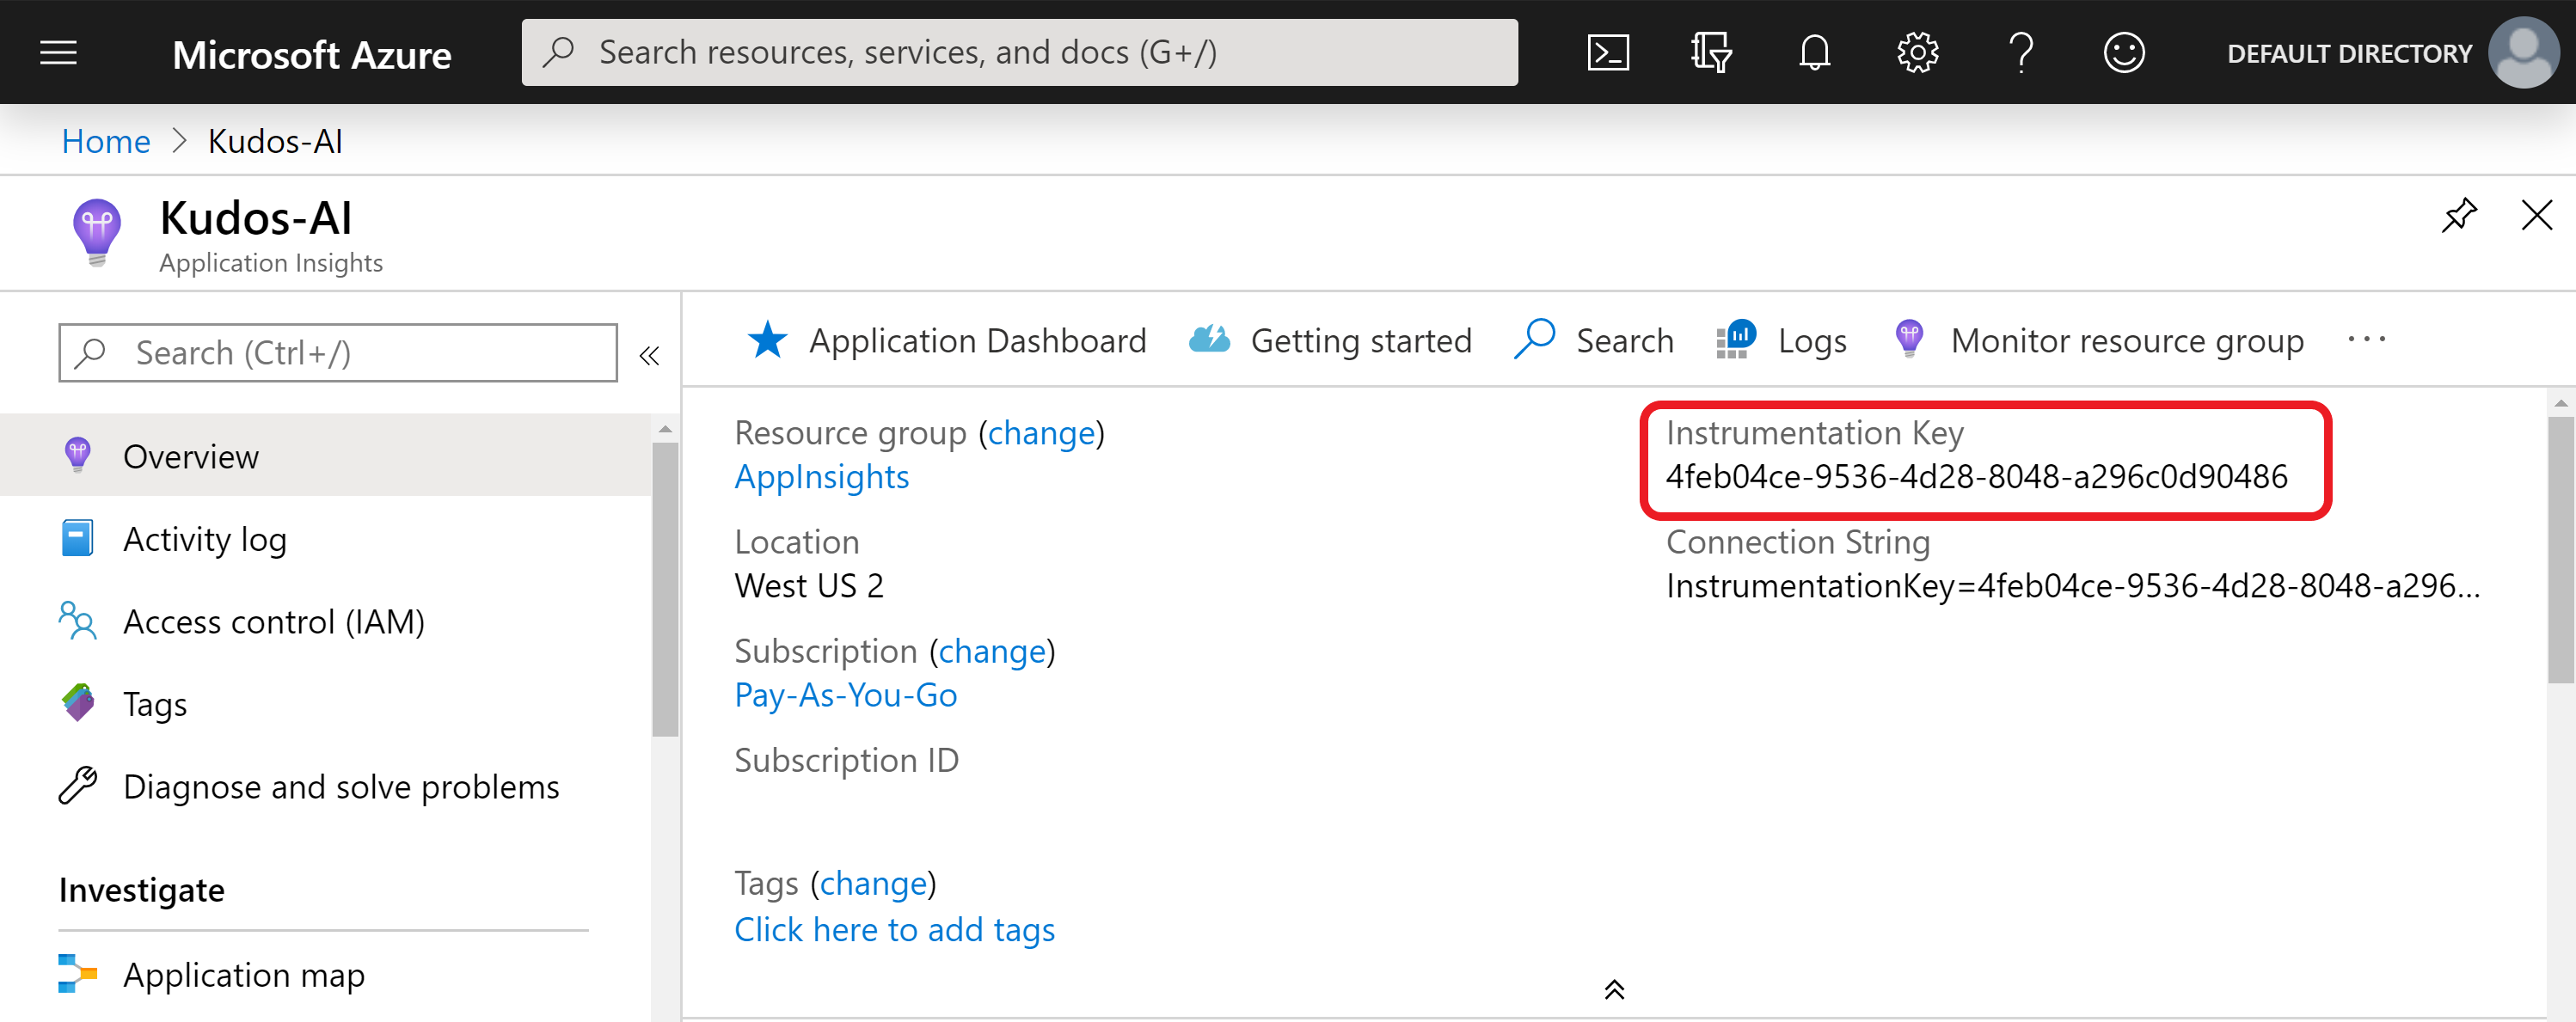
Before you can send telemetry for an app, you will need to create an Azure Application Insights resource to store the events. To create an App Insights resource, you can follow the documentation here. After you create your App Insights resource, you are going to need the instrumentation key so copy or take a note of this value.
Connect your app to Application Insights
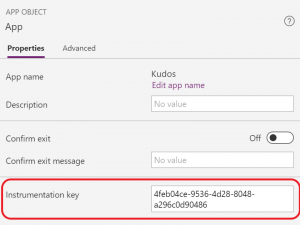
Open your app and the select the App object. In the App object panel, update the Instrumentation key property to your Azure App Insights instrumentation key. After you update the instrumentation key, save and publish your app.
Great! That’s all you need to start gathering telemetry for the app! Play the published app and navigate to various screens. Screen navigation events will get automatically logged to App Insights along with usage information on where the app is getting accessed from and on which devices and browsers. Let’s view the events and see the insights you have generated from adding the instrumentation key to your app.
Viewing events in App Insights
Open the App Insights resource you created and select Users in the left navigation menu. In this view, you can see how many people have used the app (these are not unique users, but I’ll have more about that later), the number of sessions for the app and the number of events logged. Details about where the users are located and the browsers and operating systems they use are also displayed. Drilling into one of the user sessions, you can explore detailed information such as the session length, the screens visited and also low-level transaction details.
In the Events view, you get a summary of all the screens viewed across all app sessions. You can use this information to analyse and understand screen usage or feature adoption in your app and make data-driven based decisions on your next features. For example, you may want to stop future investments on specific screens due to low usage and prioritize other features in the app.
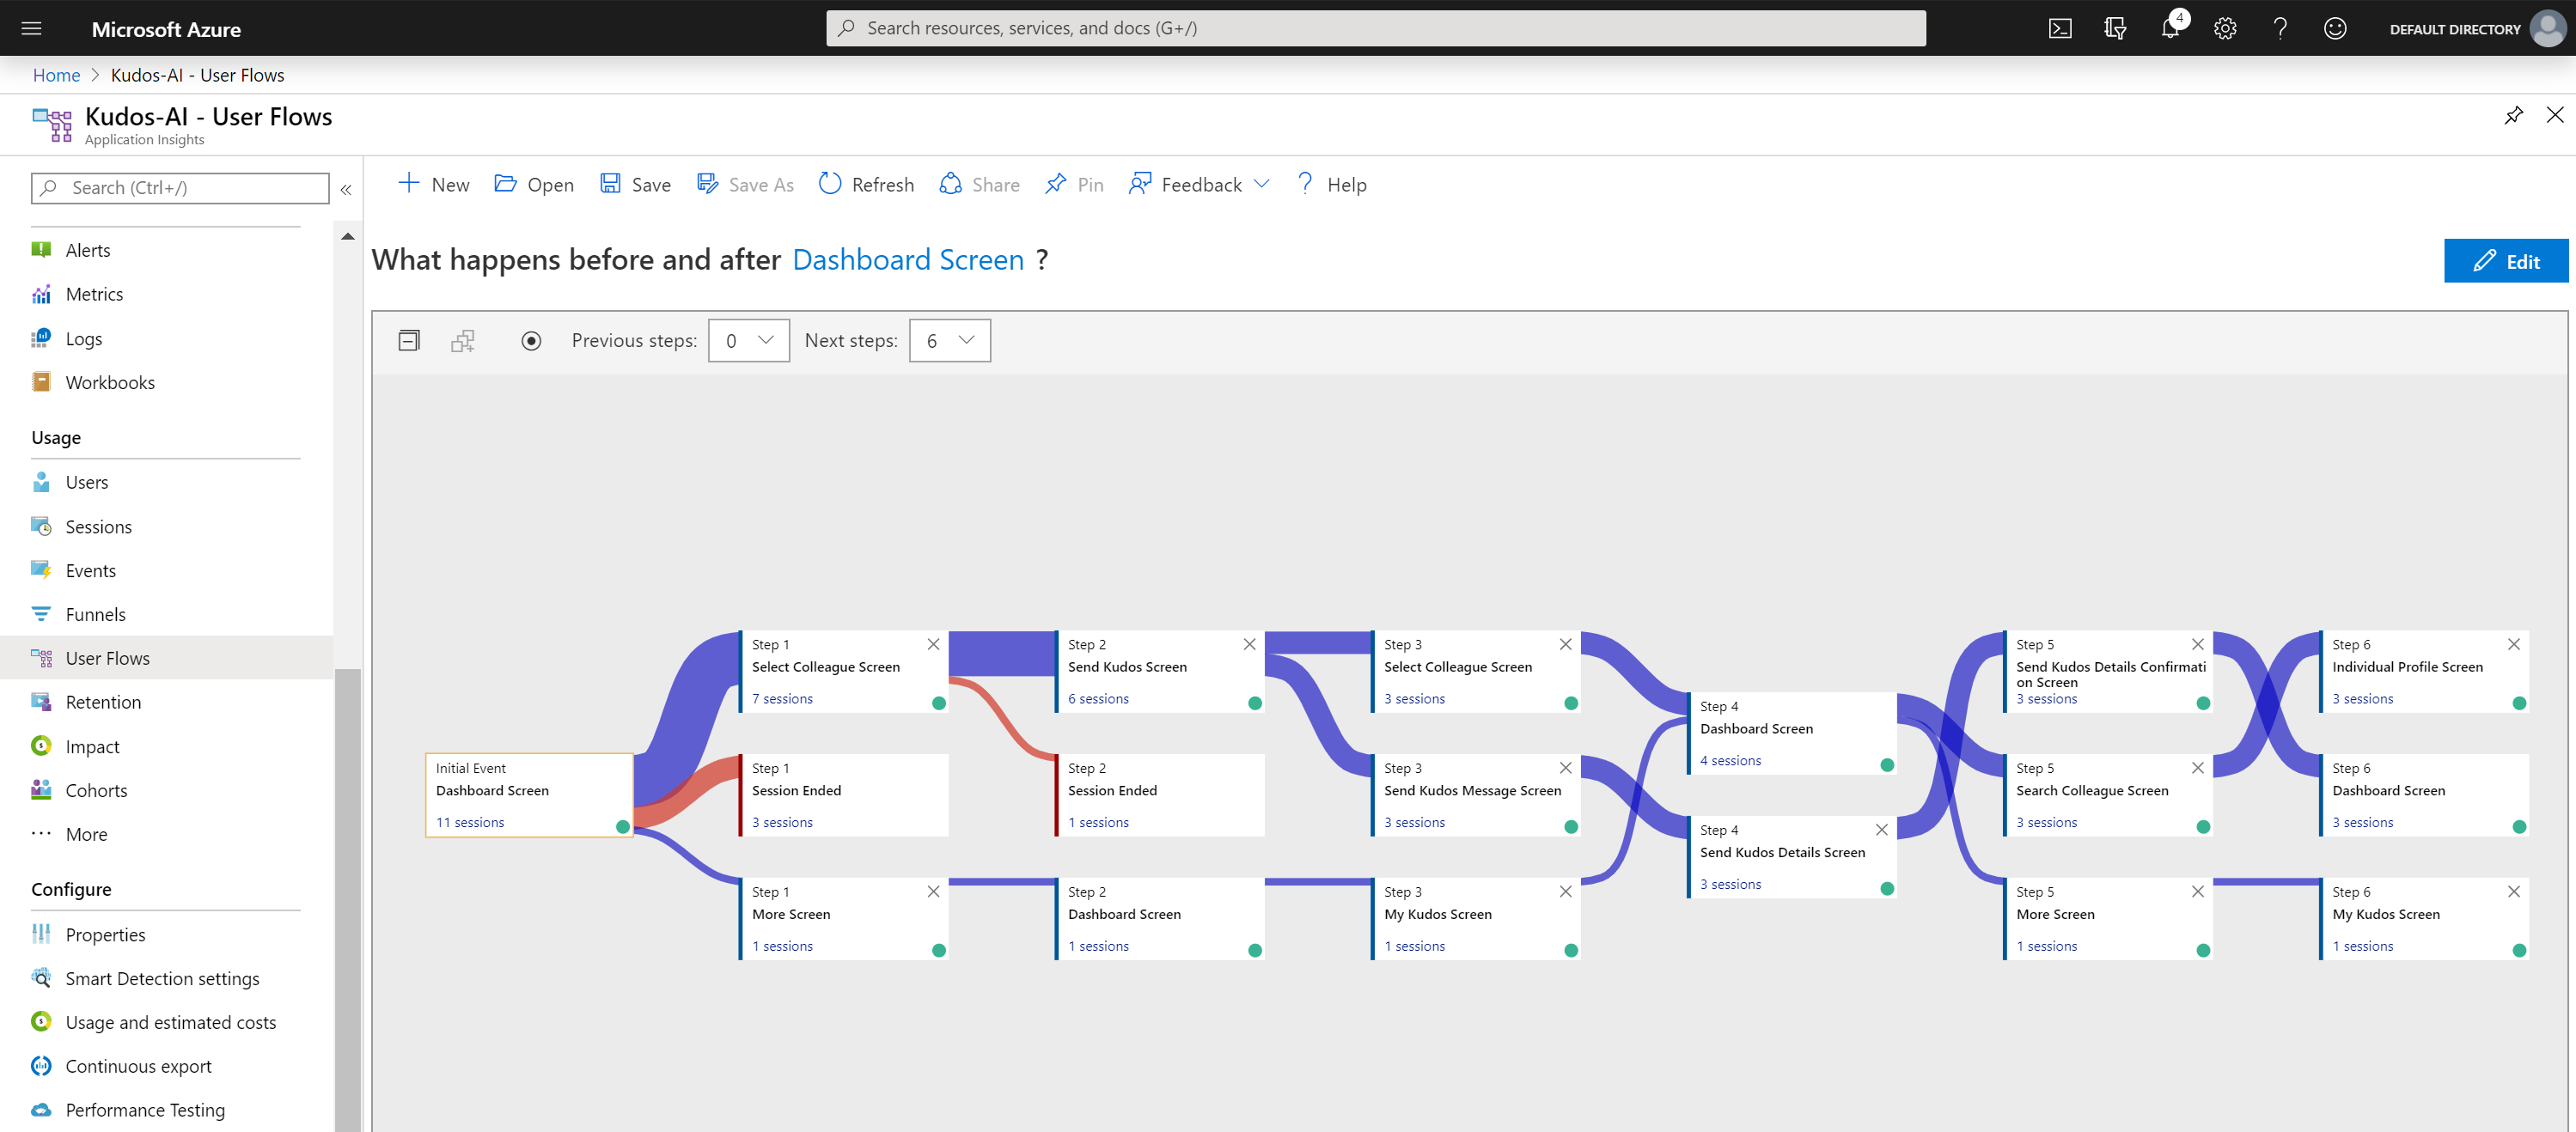
User Flows is another great visual which shows how users navigate around your app. You can use this view to analyze the most used navigation paths. Can you reduce clicks and optimize the paths to the most popular features for your end-users?
I’ve just given you a small sample of the capabilities in App Insights. App performance, Funnels and Cohorts and plenty more out-of-box features of App Insights can be further explored here.
Custom Logging
Using the new Trace function, you can also write custom traces directly to App Insights and start to analyze information specific to your scenario. Use Trace to provide more granular usage information for controls on screens, which specific users are accessing your app or even what errors are occurring. Tracing can also help diagnose various issues as you can send a trail of information as your users navigate through your app and perform various actions.
The Trace function accepts a custom message, a severity level and a custom record containing data which will be logged as custom dimensions for the event to App Insights. As well as the custom dimensions you define for each Trace event, the platform will also add a set of default dimensions to every event raised – these are the ms-appSessionId, ms-appName and the ms-appId and they can be used to help you determine the app and session the event correlates to.
So, what can I log? Well, anything really. For example, you might want to record every time a user selects a button in your app, or every time a new feature is used, or the email address of the users accessing your app.
Note: If you are logging any personnel data, you will need to consider any data compliance obligations, such as GDPR, that you may also need to implement.
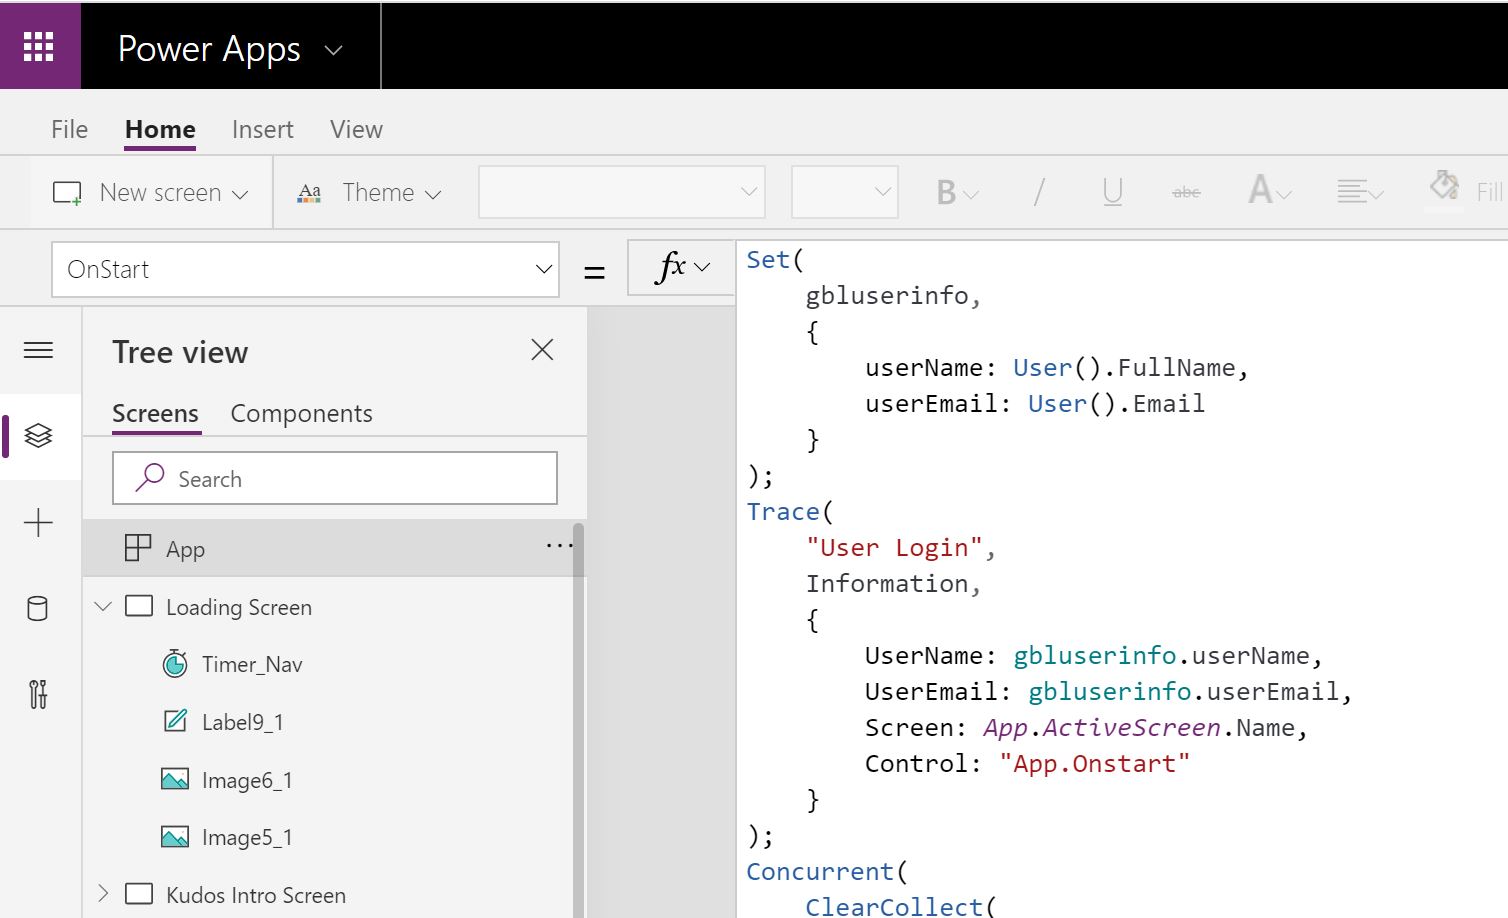
Below is an example of a Trace expression I can add to the App OnStart event to gather user login information.
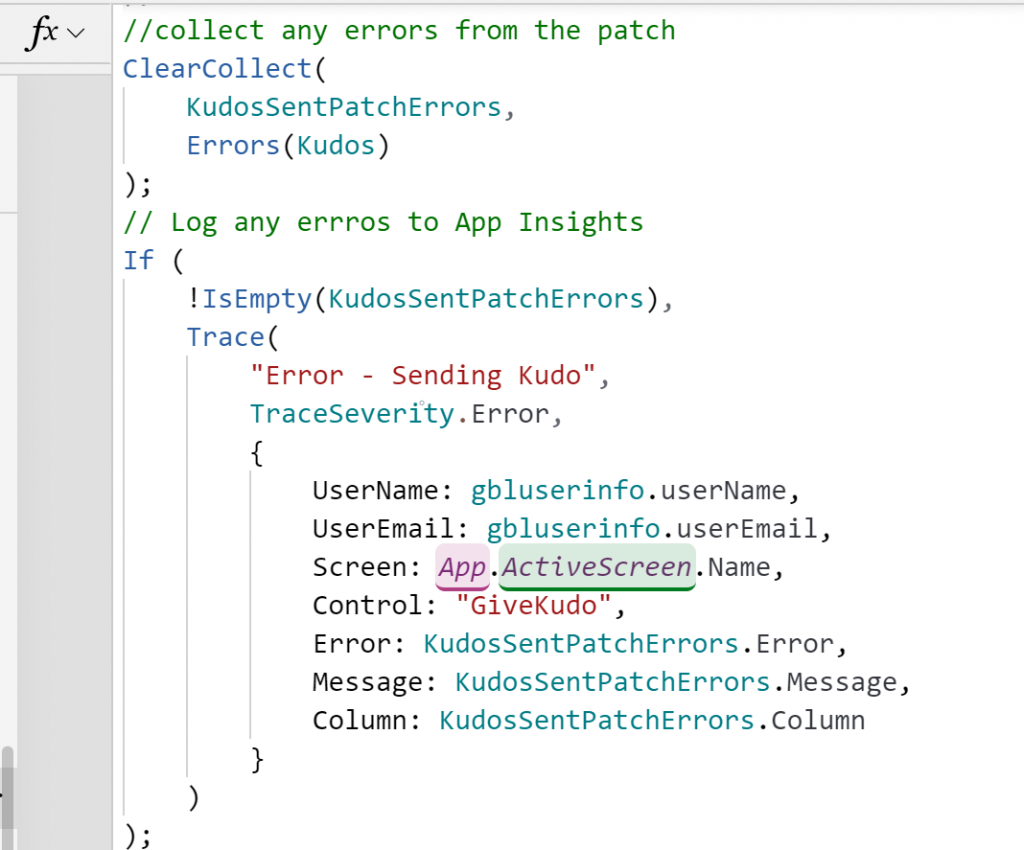
Maybe you want to know how many errors happen in your app or how many times a record failed to write to your data source. I can use the Errors function to check for a Patch error when writing a record and then log an event if any patch errors happened.
From App Insights, I can then create an alert to automatically notify me if errors get logged, or if there was a sudden increase in errors experienced in the app.
Now, after publishing and playing the app again, you will see new events generated in App Insights. These events will be displayed in the session details or you can directly query them from the Logs.
Querying Application Insights Logs
If you want to go deeper and leverage the full power of the data you are collecting, you will likely need to write log queries to analyze the App Insights data tables. Log queries are extremely powerful and you can use them to join multiple tables, aggregate large amounts of data and perform complex operations. You can learn more about Log queries here.
Using the Trace expressions I wrote above, I’d like to know which specific users experienced an error when saving my data, and at what time those errors occurred. To get this, open the Logs in the Monitoring section in the left menu, and in the window write the query below .
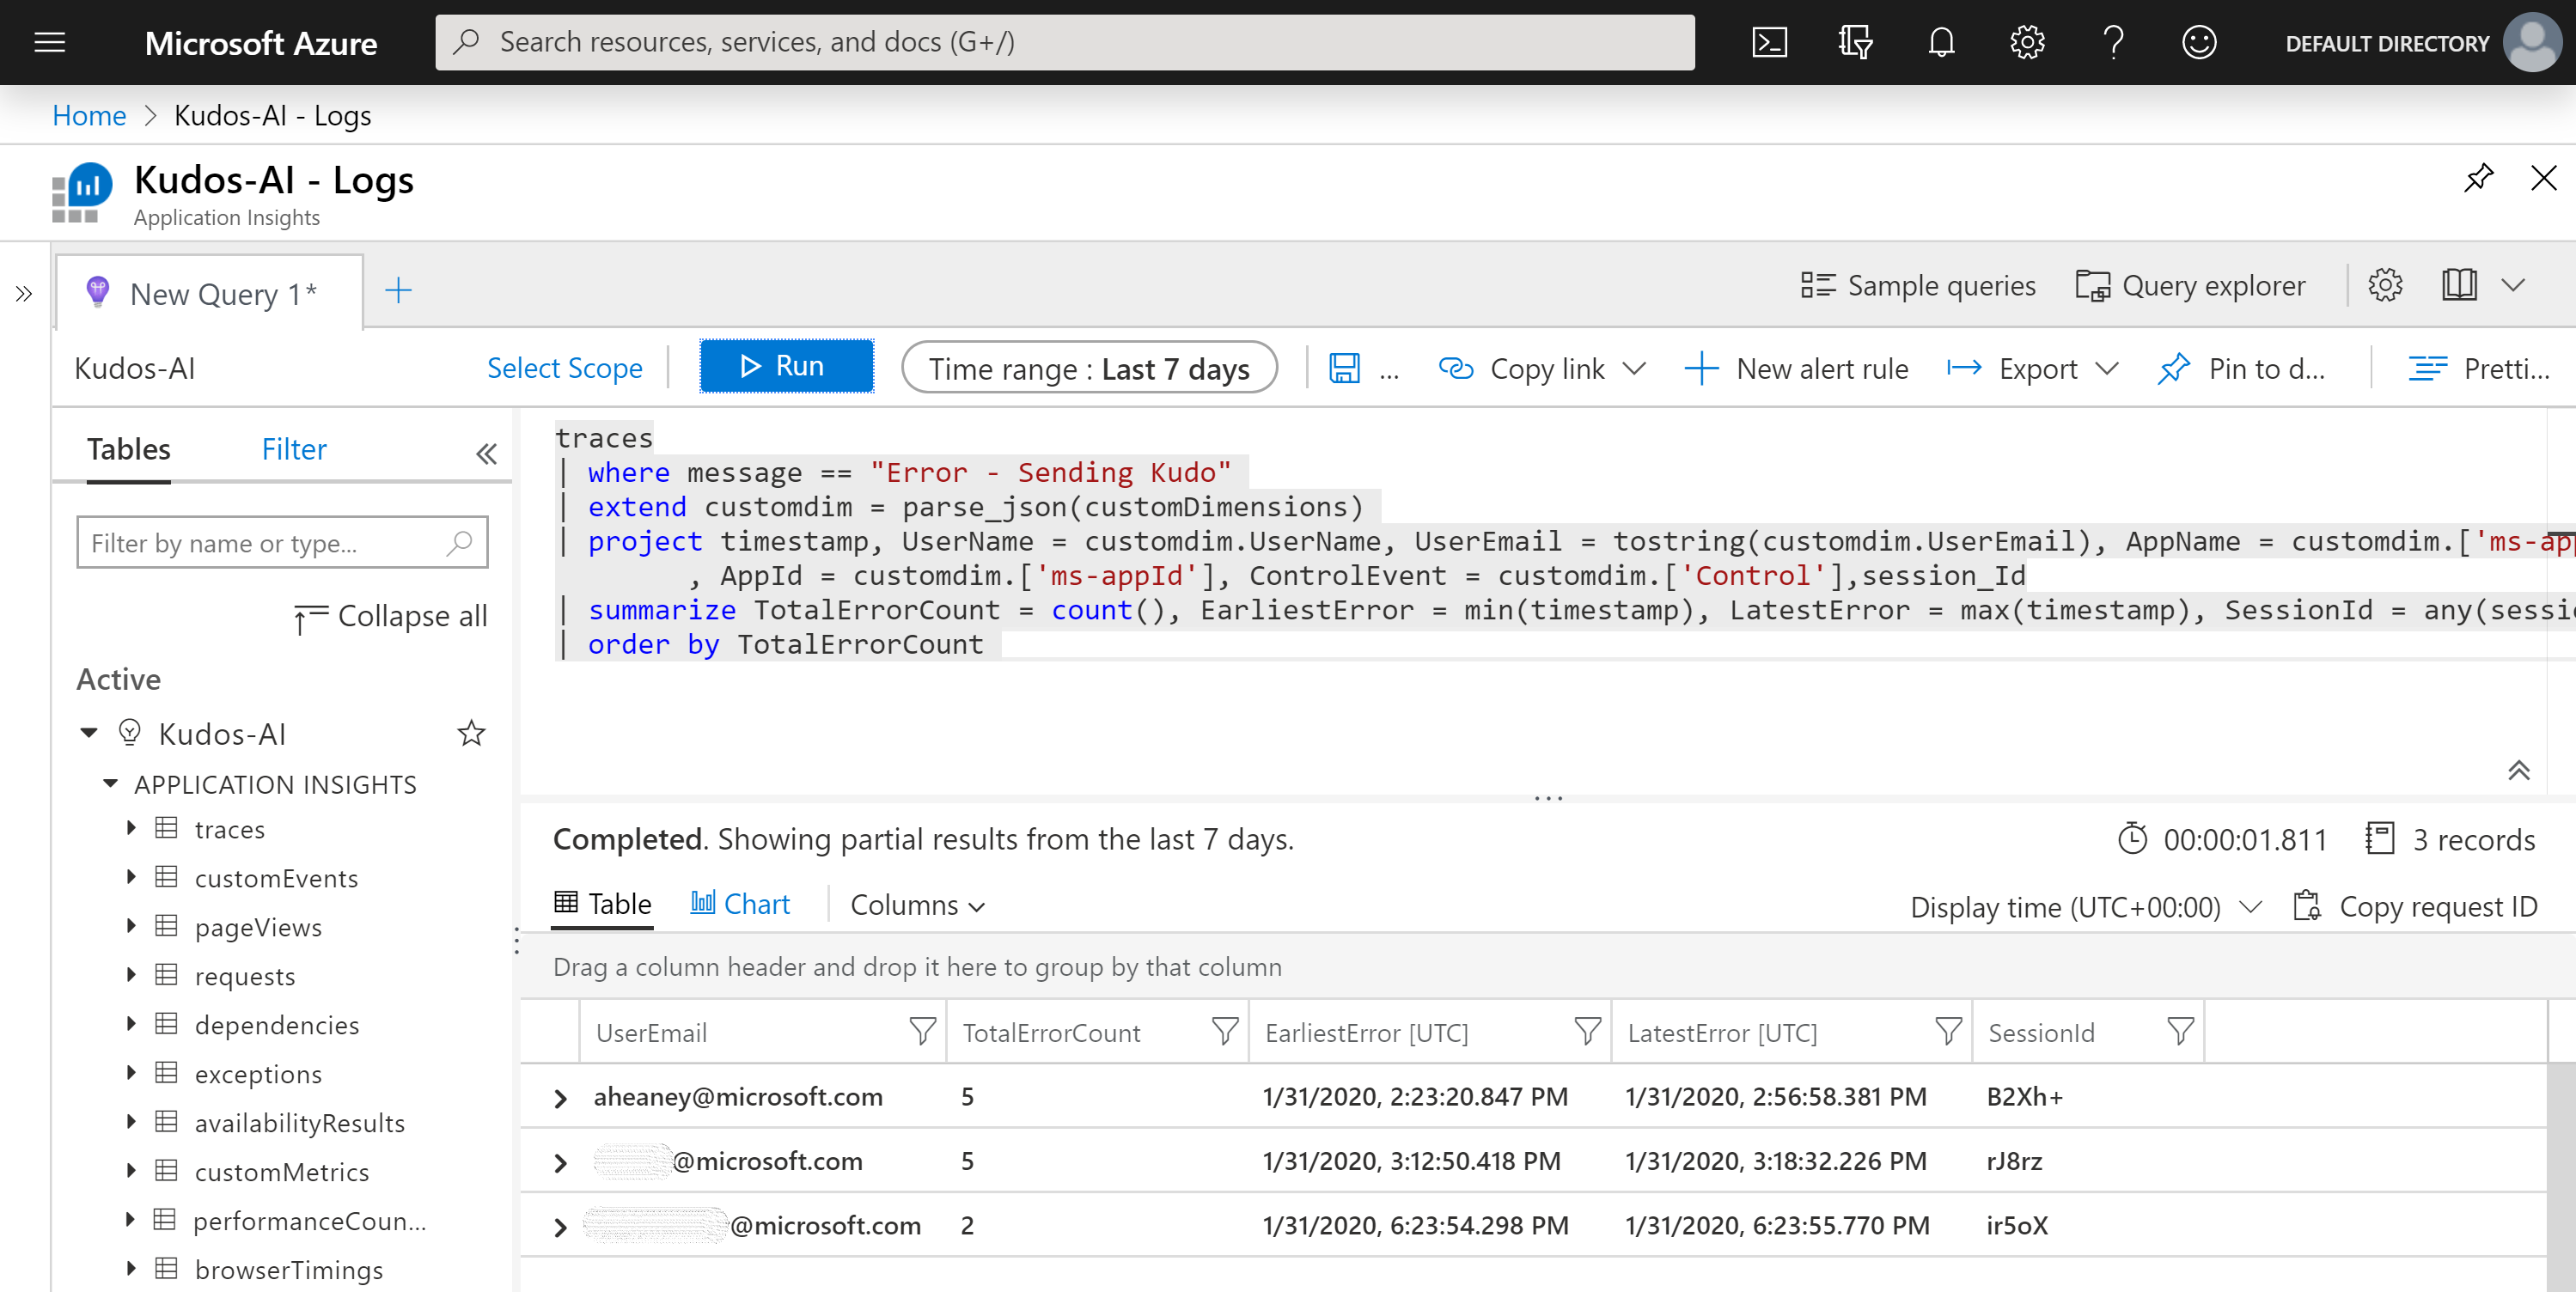
From the results, I can see 3 users received an error when saving data. In total, there have been 12 errors, and one user (yes, that’s me!) received 5 errors within a 30 min time frame. Using one of the sessions Id’s displayed, I could dive further into the various Trace and screen navigation events that happened for a session which had an error.
Other improvements coming
Earlier in the blog, I mentioned that the User counts displayed in the usage report in App Insights did not reflect unique users. We are working to fix this and pass a unique User Id with the App Insight events logged. We will also send the Power Apps session id which is visible to end users (accessed on the session details dialog screen) which will help you further analyze the user session information and any errors that occurred.
With instrumentation, you can begin to understand your app usage, performance and identify issues that may have gone unnoticed. Are there additional out-of-box events or dimensions you would like to see added? What scenarios are you trying to collect telemetry for that we could make easier? We’d love to hear your feedback and what you think about the feature!