Canvas debugging with Results View


Lots of debuggers allow you to see the value of an expression simply by selecting it in the source. You’ll recognize an example immediately:
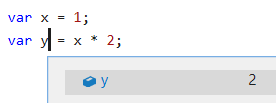
Wouldn’t it be great if Canvas apps had this same facility? Imagine:
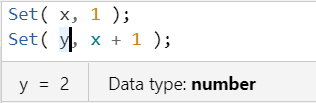
Think about the implications. You don’t need to flip to the File menu and then navigate to the collection or variable of interest to see its value. You also don’t need to add a gallery or label control just to see the value of a formula. You can freely explore the data flowing through your app. Think of the time you would save finding the root cause of a misbehaving app.
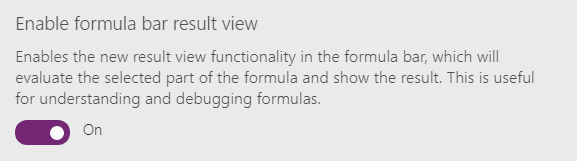
I’m pleased to announce that you don’t need to imagine it, you can experience it today. Navigate to the File > App settings > Advanced settings in your favorite app and turn on this experimental feature:
Understanding complex formulas
Le’ts look at an example that filters, sorts, and reduces a table of data. Composable functions give Canvas formulas their power by taking the output of one function and feeding it as input to the next. But in a complex formula it can sometimes be difficult to understand what each function is doing. Now we’ll be able to easily see the impact of each function in shaping the result.
Take the following formula. Clicking on Customers in the formula bar will show us the original table with all of its columns:
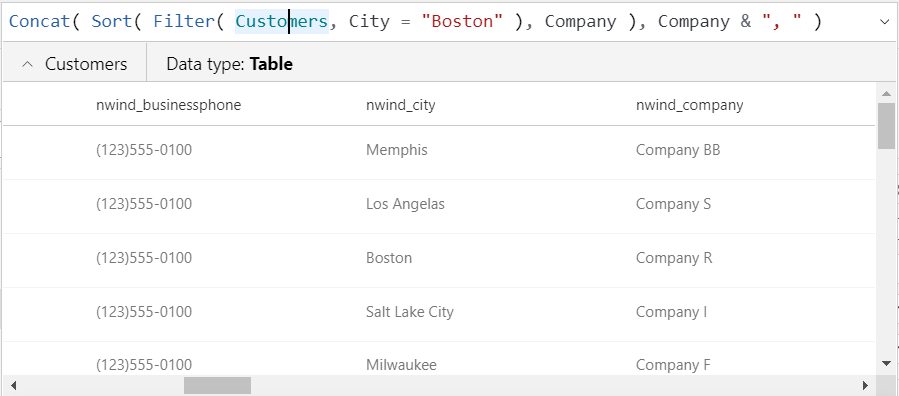
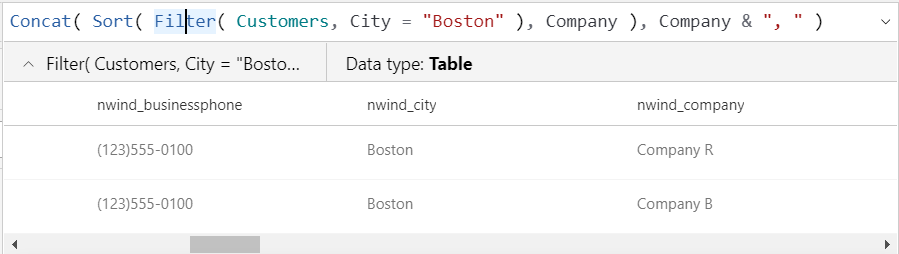
If we click out a level to the Filter function, we’ll see the result of that function which reduces the table to only two records. Literally that is all you need to do, just click anywhere on Filter (you can also select an entire formula or sub-formulas):
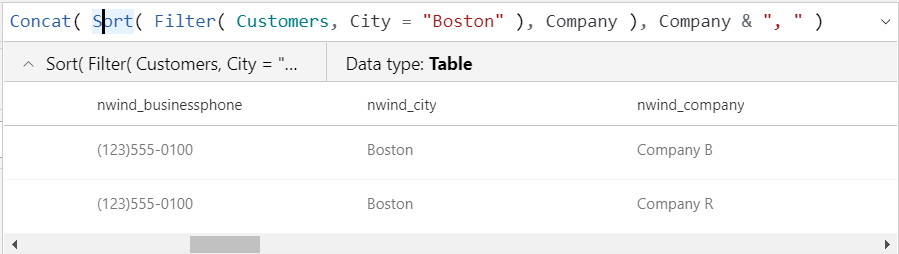
Note that the table isn’t sorted by Company name yet. Going out another level to the Sort function:
Finally, if we click out one more level to the Concat function, we’ll see the result of that function which is a text string containing two items:

Dates, colors, Booleans, numbers, records, and most other data types are supported. In fact this may be the first time you’ve seen them spelled out. Did you know that a Date is not the same thing as a DateTime? Check out the data types returned by the Today function versus the Now function.
Result view can be used to observe the output from a connector method call, for example:
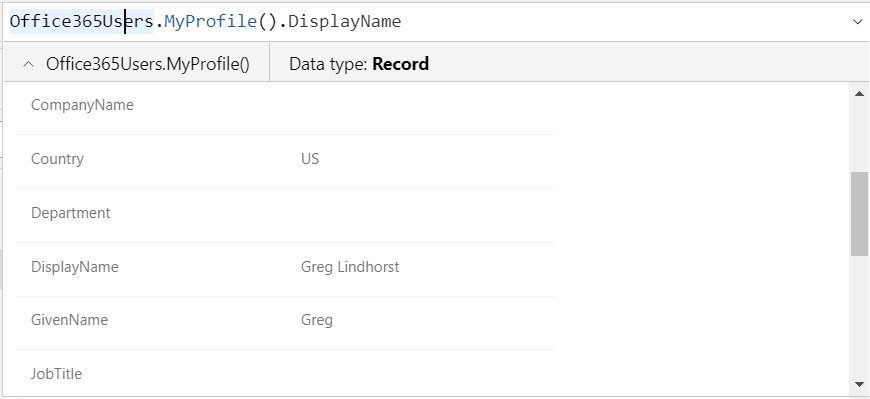
And observe the one column from this record that is actually used:

Have you noticed in this blog post that no controls have been inserted or shown and not once have we left the design experience? Haven’t needed to.
Feedback please
Why is this feature experimental? As always, we’d love to hear and incorporate your feedback. Please turn it on and let us know what you think both here and in the community forum. We know it is painful to turn it on for each app individually, we will turn this on by default soon. This feature pops up automatically as you type and we wanted to be sure of its stability first.
We would also like to close some of the functional gaps. We know of some already, such as not showing nested records and tables, something that is supported in the File menu collection and variable viewers today. We could use your help to prioritize what would be the most useful information to show in this view – please let us know what you think we should pursue first.
Will we be adding a full on interactive debugger next? No, not anytime soon. In a world where declarative formulas are automatically evaluated as dependencies change, setting a breakpoint doesn’t make a lot of sense. But we are actively working on more tools to make it easier to understand, diagnose, handle errors, test, and “debug” your apps.
