Creating Updateable Power BI Reports with PowerApps by Ike Ellis


When asked what content our blog readers and video viewers would like to see more of, the most requested topic is: “Industry Best Practices”. With that in mind we will be starting a series of Blog posts and Webinars by PowerApps MVPs highlighting work they have done.
The first in this series by Ike Ellis (see bottom of post for more about Ike) and in this post he highlights how you can create a solution that enables a mobile sales force to update their own Power BI reports.
Webinar on this topic: September 12th 10AM PST
Where: Community Gallery
Combining PowerApps with Power BI to create powerful and compelling solutions
By Ike Ellis
One of my customers is a very large RV dealer with multiple locations. They allow sales people to set their own monthly goals. They wanted a Power BI report that would update when sales came into the database and when salespeople updated their particular goals for each month. Creating an updateable report is a very common request from customers.
Each RV dealership is humongous. RVs are individually large, so when you’re selling a lot of them, the lots have to be pretty large to accommodate them. It is very difficult to cover a lot that size in WIFI. Additionally, sales people often engage with customers away from the dealership. This made Microsoft PowerApps an ideal solution for updating their goals and sales. PowerApps for mobile devices can use the mobile network, in addition to WIFI. PowerApps can use the PowerApps gateway to query and update records in databases that are behind firewalls.
Combining PowerApps with Power BI, along with all the Azure services, really makes each individual product so much more powerful and compelling to the customer. If we’re comparing Power BI with its competitors, emphasizing how easy it is to integrate with these other products is a major competitive advantage. After we showed a demo of the solution to the customer, it was an easy sell. There really is no competition.
This blog post is a simplified version of the app I created for the customer. It will show how a Salesperson can update their goal for the month, while decision makers can see the Power BI report update as the data refreshes.
For our demo, we’ll be using three Microsoft products together: Power BI, PowerApps, and Azure SQL Database.
- Download Power BI Desktop from either the Windows Store or from here: https://powerbi.microsoft.com/en-us/downloads/.
- We would normally publish our report to the Power BI portal, but that’s beyond the scope of this demo. Please see: https://docs.microsoft.com/en-us/power-bi/service-publish-to-web for more information on that topic
- Microsoft Azure free trial instructions: https://azure.microsoft.com/en-us/free/
Microsoft PowerApps signup: https://powerapps.microsoft.com/en-us/signup/
We will use Azure Data Studio to create two tables in Azure SQL DB and seed them with data. Download and install Azure Data Studio here: https://docs.microsoft.com/en-us/sql/azure-data-studio/download?view=sql-server-2017
- Sign in to https://portal.azure.com
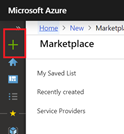
- Click the “Create a Resource” button in the upper left of the portal.
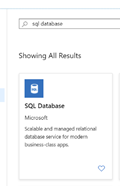
- Search for “SQL Database” and click on the first result
- On the welcome screen, click “Create”.
- Choose your subscription and location. Try to pick a datacenter that’s close to you. I chose “West US”, since I live in San Diego, California.
- Type “SalesDB” as the name of the database.
- Create a new server or choose an existing server.
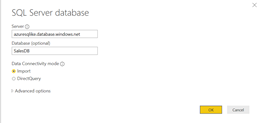
- Choose a name for the server. It needs to be globally unique. When you connect to the database from PowerApps and Power BI, you’ll use the full name, which will include the unique name you just entered with a prefix of “.database.windows.net.”
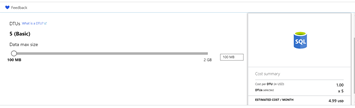
- Click “Configure database”. This is where we will choose how much money we will spend on our database. For a real production application, we would obviously try to predict our load and size the database accordingly. For our demonstration, we can just use the cheapest solution possible. I chose a Basic tier database. I slid the slider bar for the amount of space I need down to 100MB. At the time of this writing, this database will cost about $5 per month. Not bad. Click “Apply”.
My filled out form looks like this:
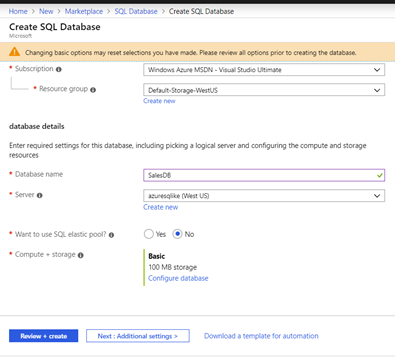
- Click “Review + create” and then “Create”.
- One of the things that amazes me most about Azure is how quickly resources come online and are available to use. As a developer, I’ve put in requests with IT departments for my entire career. When I ask them to create a SQL Server with a new database for me, it usually takes between two weeks and two months. In Azure, it’s done in less than five minutes!
- When it says the deployment is complete, click “Go to resource”.

- Azure SQL DB has a built-in firewall. Three things need access to your new Azure SQL Database: your workstation, PowerApps, and Power BI. Click on “Set Server Firewall” to configure the firewall.

- Make sure you click “Add Client IP” and verify that the button for “Allow access to Azure Services” is selected. Then click “Save”.

- In the next few steps, we’re going to use Azure Data Studio to create a login account and password, assign permissions, create two tables, and seed those tables so that we can use your new Azure SQL Database.
- On the connections window, click “New Connection”

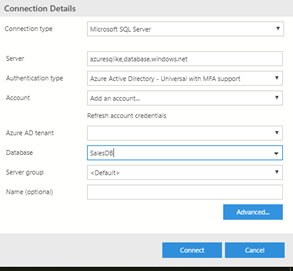
- Under Connection Details, type in your unique servername that you choose earlier. Remember it ends with “.database.windows.net”.
- Under authentication type, click “Azure Active Directory – Universal with MFA Support”
- Under account, click “Add New Account”.
- This screen will direct you to go to a URL and enter in a code while helping you login to your Azure Account. This will authorize your Azure Data Studio to connect to your Azure SQL Server.

- Under Database, type “SalesDB”.
- Your Connection Details should look like this with the correct account selected:
- Now in the connection window, right-click on your new server and click “New Query”
- Paste the following code in the window and run it.
drop
table
if
exists SalesPeople;drop
table
if
exists goals;drop
table
if
exists Sales;go
create
table SalesPeople(SysID int
not
null
identity(1,1) PRIMARY
KEY, SalesPersonFullName varchar(100))
GO
insert
into SalesPeople(SalesPersonFullName)
VALUES
(‘Sterling Sanchez’)
, (‘Rick Archer’)
, (‘Morty Figgis’)
, (‘Lana Smith’)
go
create
table Sales(SysID int
not
null
identity(1,1) PRIMARY
KEY, CustomerName varchar(100)
, OrderDate datetime
, SalesPersonID int
, SaleAmount decimal(14,2))
go
create
table Goals(SysID int
not
null
identity(1,1) PRIMARY
KEY, SalesPersonID int
, GoalMonth int
, GoalYear int
, GoalAmount decimal(14,2))
go
insert
into Sales(CustomerName, OrderDate, SalesPersonID, SaleAmount)
VALUES
(‘Arch Burgers’, ‘7/1/2019’, 1, ‘520.00’)
, (‘Bob”s Investigative Service’, ‘7/3/2019’, 1, ‘139.00’)
, (‘Arch Burgers’, ‘7/13/2019’, 1, ‘272.00’)
, (‘Southland Laundry’, ‘7/21/2019’, 1, ‘499.00’)
, (‘Smith Consulting’, ‘7/2/2019’, 2, ‘296.00’)
, (‘Reed Gardening Services’, ‘7/13/2019’, 2, ‘321.00’)
, (‘Fashion Design By Gilbert’, ‘7/25/2019’, 2, ‘673.00’)
, (‘Sterling Bar and Grille’, ‘7/30/2019’, 2, ‘152.00’)
, (‘Allington Investment Advisors’, ‘7/3/2019’, 3, ‘210.00’)
, (‘Rad Construction Supply’, ‘7/5/2019’, 3, ‘329.00’)
, (‘Sterling Bar and Grille’, ‘7/7/2019’, 3, ‘199.00’)
, (‘Allington Investment Advisors’, ‘7/17/2019’, 3, ‘195.00’)
, (‘Johnson Tool & Die’, ‘7/22/2019’, 3, ‘52.00’)
CREATE USER SalesUser WITH
PASSWORD
=
‘PowerAppsAreGreat!’ALTER
ROLE db_datareader ADD MEMBER SalesUser;ALTER
ROLE db_datawriter ADD MEMBER SalesUser;
- Create a PowerApps application that allows SalesPeople to enter their goals for the month.
- Go to https://make.powerapps.com
- On the left, click “Create” and the click “Canvas app from blank”

- Name the app “Sales Goals” and select the phone layout. Click “Create”.
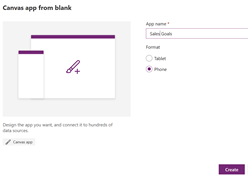
- It will take a minute to create the new application.
- You may need to skip a welcome screen.
- We are going to connect this app to our Azure SQL Database. Click the “View” tab, then click “Data sources”. Type in “sql server” into the text box and click the red SQL Server icon.
- Click “Add a Connection”.

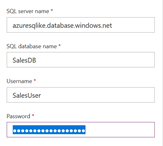
- Since our database is in Azure, we’ll click the radio button “Connect directly (cloud services)”.
- Type in the SQL Server name from earlier that ends in “.database.windows.net”.
- Type in SalesDB as the SQL database name.
- Type SalesUser as the Username.
- Type PowerAppsAreGreat! as the password.
- For the table, we’ll select “Goals” and “Salespeople” and click “Connect”.
- Our goal is to create to create a screen that looks like this:

- We are going to create one data entry element at a time and then add the button. Then we’ll test our application.
- Let’s start with the label at the top. On the Insert tab at the top bar, click “Label”. In the Text property, enter “ENTER GOAL AMOUNT FOR MONTH (0.00)”. Include the double quotes.

- On the right side, you’ll see the PowerApps property window. You can use this window to control the behavior of an individual control in PowerApps.
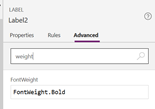
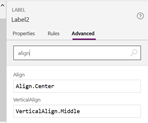
- Click on the Advanced tab on the window on the right.
- In the search area, type “weight”.
- Change the FontWeight to Bold
- Change the Align to “center”.
- We will be following that pattern with a lot of these properties without giving accompanying screenshots.
- Now let’s add dropdown list for Goal Month.
- Add a label to the control. Change the Text value to “Goal Month:”
- Add a Drop Down control. On the left window. You’ll see a new dropdown titled DropDown1. Next to the name, you will see an icon with the ellipsis (…). Click on it and rename it to ddlGoalMonth. You will be renaming many of the controls. The completed Tree view on the left will look like this

Table(
{
Text: “January”,
Val: 1
},
{
Text: “February”,
Val: 2
},
{
Text: “March”,
Val: 3
},
{
Text: “April”,
Val: 4
},
{
Text: “May”,
Val: 5
},
{
Text: “June”,
Val: 6
},
{
Text: “July”,
Val: 7
},
{
Text: “August”,
Val: 8
},
{
Text: “September”,
Val: 9
},
{
Text: “October”,
Val: 10
},
{
Text: “November”,
Val: 11
},
{
Text: “December”,
Val: 12
}
)
- This makes the dropdown display the individual months in the correct order. It also assigns a value to the month so that it sorts correctly.
- Now let’s create the dropdown for Goal Year.
- Add a label and change the Text property to “Goal Year:”.
- Add a drop down. Rename it to ddlGoalYear.
- Change the Items property to [“2019”, “2018”]. In this case the value and the text are the same thing, so we don’t need to use a Table function in our code like we did for month.
- Create the dropdown for Salesperson.
- Add a label and change the Text property to “Salesperson:”.
- Add a drop down. Rename it to ddlSalesperson.
- Change the Items property to ‘[dbo].[SalesPeople]’.
- Change the Value property to “SalesPersonFullName”.
- Create the textbox for Goal Amount.
- Add a label and change the Text property to “Goal Amount:”.
- Add a text input control. Rename it to txtGoalAmount.
- Clear out the Default property.
- Add the Save button
- Add a button control. Rename the control btnSave.
- Change the Text property to “Save”.
- Change the OnSelect property to the following code:
RemoveIf(
‘[dbo].[Goals]’,
SalesPersonID = ddlSalesperson.SelectedText.SysID,
GoalMonth = ddlGoalMonth.SelectedText.Val,
GoalYear = Value(ddlGoalYear.SelectedText.Value)
);
Collect(
‘[dbo].[Goals]’,
{
SalesPersonID: ddlSalesperson.SelectedText.SysID,
GoalMonth: ddlGoalMonth.SelectedText.Val,
GoalYear: Value(ddlGoalYear.SelectedText.Value),
GoalAmount: Value(txtGoalAmount.Text)
}
)
-
- Each salesperson can only have a single goal for the same month and year. The REMOVEIF function finds a matching record on those three criteria and deletes the record. It then adds a new record based on the inputs
- Let’s add a few goals and then check the database to see if the goals have updated.
- Hit F5 to launch the application in your browser.
- Add goals for each of the sales people for July 2019.
- Make sure the goals are at least over $500, but below $3,000.
- Click the save button.
- Go back to Azure Data Studio. Open a New Query window for the SalesDB database. Enter “SELECT * FROM GOALS”. Execute that code. You should see records for goals for each of your sales reps.
- There are a few improvements that we would make to this application before releasing it. I didn’t add these to this post because it would detract from the main solution.
- When the user logs on to PowerApps, PowerApps knows the email address that the user used. This is the same email address that was configured when we shared the application to the user. Using this email address, we know who the user is and wouldn’t need them to select their own name in the dropdown.
- Give the user the ability to see and search through all of their old goals.
- Create an approval process where managers see the goal and approve it or deny it.
- Create an audit log where we can see who entered what goal and when for accountability.
-
- Create a status bar that provides feedback to the user so they know a record was successfully inserted.
- Now let’s make the Power BI report that the decision makers will see.
- Open Power BI Desktop
- Let’s import all the data we need
- Click “Get Data”
- Choose “SQL Server”
- For the server name, put the same server name you entered into PowerApps.
- Enter “SalesDB” as the database.
- Click OK.
- On the next screen, click the “Database” tab on the left. Enter your username and password: SalesUser and PowerAppsAreGreat!
- Click OK.

- Choose the Sales, Salespeople, and Goals tables. Click OK.

- Click OK. This will import all of your data from SalesDB into a Power BI dataset.
- We need to do a little data preparation before we can create our visuals.
- Let’s add two columns so we can join the Sales table and the Goals table.
- On the navigation pane on the left, click the “Data” tab. This is the tab in the middle.

- On the right, next to the Goals table, click the Elipsis button (…). Click “New Column”.

- In the DAX editor, enter the following DAX:
JoinKey = FORMAT(Month(Sales[OrderDate]), “#”) & “-” & YEAR(Sales[OrderDate]) & “-” & Sales[SalesPersonID]

- The table should now look like this:

- The JOIN column is month, year, and salespersonID concatenated. We’ll do the same thing for the Sales Table.
- Click the ellipsis button for the Sales Table. Add a New Column. Enter the following DAX:
JoinKey = FORMAT(Month(Sales[OrderDate]), “#”) & “-” & YEAR(Sales[OrderDate]) & “-” & Sales[SalesPersonID]
- Now let’s change the data model a little bit. Click Data Model tab, the bottom tab, on the left. Your screen should look like this:

- Double-click on the relationship between the Goals table and the Sales table.
- Make the screen look like the following screenshot. Choose the JOINKEY column for both tables. Verify that the cardinality is Many to One. Make sure the Cross filter direction is set to Both:

- Change the relationship between the Sales and Salespeople table.
- Make sure the relationship is Many to One. Make sure the Cross filter direction is set to Single.

- Finally, we can add the visuals. We’ll create two simple visuals on the visual pane.
- Click the Visual button on the left.

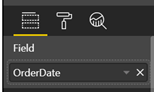
- Add a slicer visual to the report
- From the Sales table, drag OrderDate to the Field property.
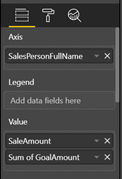
- Add a clustered bar chart to the report.
- Add SalesPersonFullName (from the Salespeople table) to the Axis property. Add SaleAmount (from Sales table) and GoalAmount(from Goals table) to the Value property.
- Your report should look like this:

- You can clearly how the team is doing in relationship to their goal. As Salespeople make sales or enter goals into PowerApps, this dashboard will update. You can experiment with this by either inserting sales for Lana in Azure Data Studio and adding a goal for her in PowerApps for July, 2019. Come back to Power BI Desktop and click “Refresh” and see the new data in the report.
We have a hidden MVP in this solution in Azure Active Directory. Azure Active Directory users are the sharing mechanism in both PowerApps and Power BI. We can also grant AAD permissions to Azure SQL Database. This allows us to have a single sign-on between these products and easily know what users have access to which resources. This might seem trival and simple to people familiar with the Microsoft ecosystem, but it is very difficult to accomplish in competitive products.
And that’s it! We just created a great tool with PowerApps and Power BI. You can see that integration between these products is frictionless and powerful!

About the Author Ike Ellis
With over 18 years of experience in databases and a current Microsoft MVP, Ike has been Microsoft certified since the beginning, currently holding an MCDBA, MCSE, MCSD, and MCT.
Ike is the General Manager of Data & AI for Solliance. We have a full team of cloud data engineers and data scientists. We specialize in building highly scalable data solutions for any size of organization.
Ike is a partner in Crafting Bytes, a San Diego software studio and Data Engineering group. We build software and BI solutions for companies all around the country.
In 2010, Ike founded the San Diego Tech Immersion Group (SDTIG). It has grown to be the largest user group in San Diego with over 125 active members including three other Microsoft MVPs. It is a technical book club that reads a book on a significant technical topic. Recent topics include Linux on Microsoft Azure, Angular 2/TypeScript, Data on Azure, Python for Data Scientists, and Docker/DevOps. In July 2018, SDTIG started a track on Docker/Kubernetes. We will start a new track on Databricks/Spark in November 2018. You can join virtually and watch the youtube live stream: www.sdtig.com
Ike leads the San Diego Power BI and PowerApps user group that meets monthly. Find out more at https://www.pbiusergroup.com/communities/community-home?CommunityKey=a08275c5-90cb-4ba8-905b-646462aa1044
For more information, see www.ikeellis.com
